01
Selcoin AI
This demo plays the sample prompt. Continue in Selcoin AI for your own idea.
Open Selcoin AILive charts + unique data + SelScript + Selcoin AI. Describe your idea, create an indicator and run it on your chart.
Focus on your idea. Bring your analysis to life on the chart.
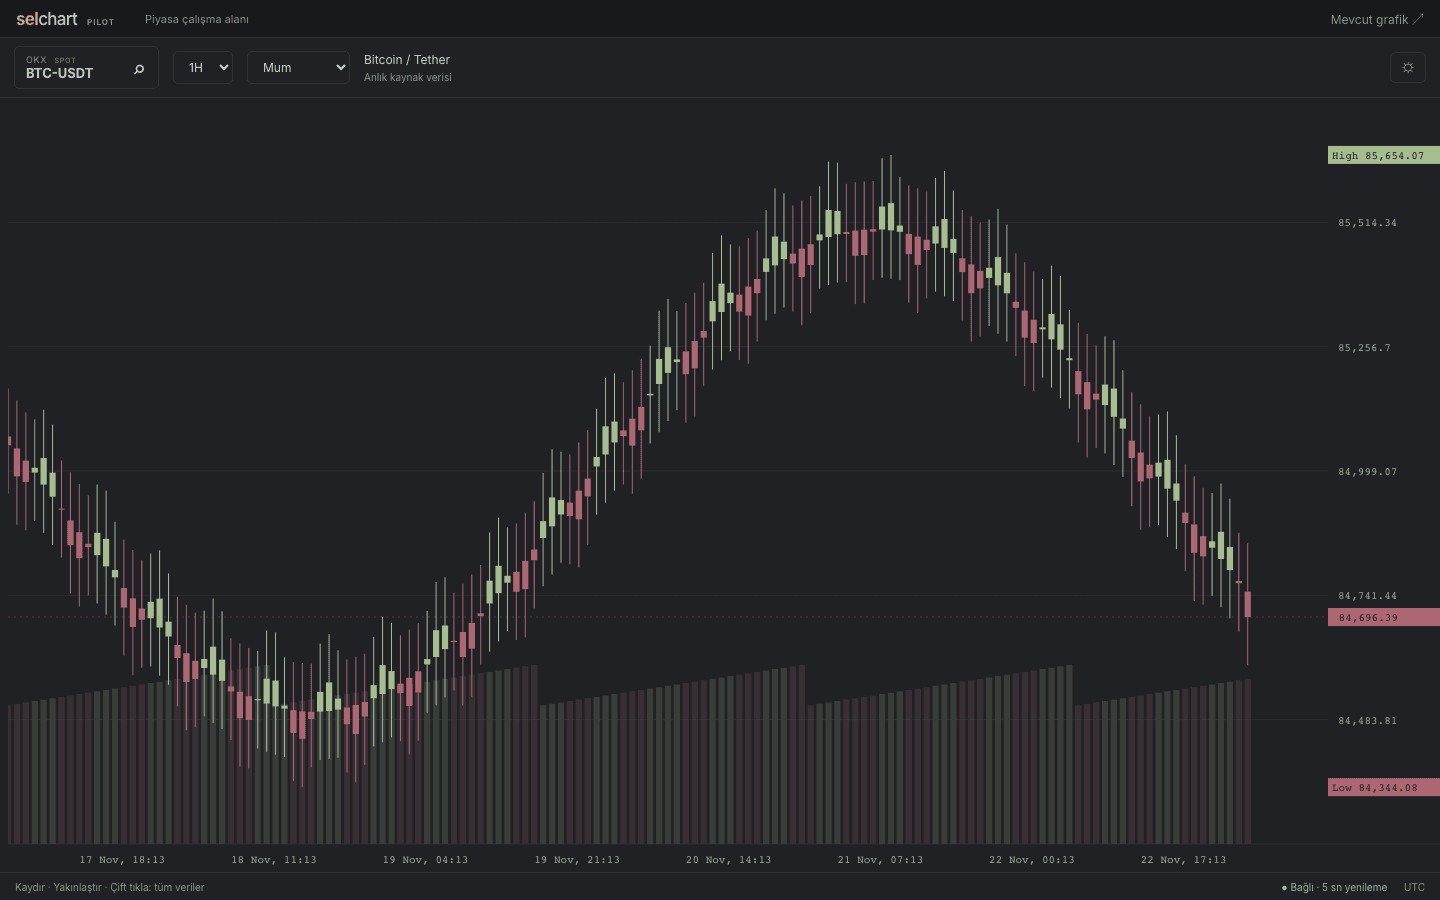
Describe your rule. See it become SelScript, then see the result on a chart in three steps.
This demo plays the sample prompt. Continue in Selcoin AI for your own idea.
Open Selcoin AI//@selscript=1indicator("RSI + Volume", overlay=true)rsi = ta.rsi(close, 14)volumeUp = volume > volume[1] * 1.2if rsi < 30 and volumeUp: signal("BUY")Your signal appears here when the rule runs.
INTERACTIVE DEMOIllustrative data, not a live market feed or real AI output.
Bring perspectives from momentum to company fundamentals into your workspace.
Read the strength of a move and shifts in momentum.
Add to my chartPut market cycles into a broader perspective.
Add to my chartFollow shifts between fear and appetite alongside price.
Add to my chartKeep key price zones at the center of your analysis.
Add to my chartConnect options positioning with price levels.
Add to my chartReview growth, profitability and cash flow at a glance.
Add to my chartIllustrative previews. Add opens a library search; availability depends on your account and data coverage.
Explore all indicatorsPrice doesn’t tell the whole story. Add macro, on-chain and proprietary analysis to your perspective.
INTERACTIVE DEMOTry up to four sample layers together. These are conceptual examples, not a claim that every dataset is available in the product.
Compare markets side by side. Sync symbols, time and crosshairs to build your own analysis desk.
INTERACTIVE DEMOTemplates are previews. Try the controls; these selections are not saved to your account.
Build your deskKeep the logic you’ve already built. Paste your code, review the conversion and run it in SelChart.
Your SelScript output will appear here.
Choose an example or paste your code.
INTERACTIVE DEMOSample conversion flow. For actual AI assistance, Selcoin AI
An open candle, a closed value and an early preview are different. Know which one you are looking at.
An open candle is updating. Its value can still change.
Source and finality detailsSource: OKX
Last update: 13:41:03
Status: LIVE
Awaiting candle close
Closed and verified data. A stable reference for your analysis.
Source and finality detailsSource: OKX
Last update: 13:00:00
Status: CONFIRMED
Candle close verified
An early view. It may change after source verification.
Source and finality detailsSource: Selcoin
Last update: 13:40:58
Status: PREVIEW
Not yet finalized
Display example. Source and time values are not live. Expand a card for details.
An analysis experience that brings price, indicators and data layers into the same conversation.
“Find Nasdaq 100 stocks with Momentum Pulse above 60 and revenue growth above 20%.”
Future product conceptCalculation, safety and data finality are handled underneath so you can focus on your analysis.
Incremental calculation updates affected computations without replaying the entire history on every open-candle change.
Sandboxed execution runs user code in a Web Worker with computation and memory limits.
Versioned scripts pin the revision used by your chart until you choose to change it.
The confirmed data model separates finalized results from preview values that can still change.
Chart + AI + programmable analysis + alternative data. One workspace.
Create your first workspace